

The NBA is More Talented Than Ever
How the talent depth of the NBA stacks up over the last 30 years


“I think we’re at the peak of basketball.”
- Kevin Durant
Kevin Durant thinks this era of basketball is the best it has ever been. Players are doing extraordinary things on the court every single night. There is more parity in the Association than ever before. Once this season’s champion is crowned, we will have had seven different teams win the Championship over the last seven years, a feat that has never been achieved before. The last time the NBA had six different champions in six years was 1975 - 1980.
Maybe the new cap restrictions and second apron have something to do with it, but that didn’t go into effect until the 2024 offseason. Personally, I agree with Durant and believe we are seeing more parity because the talent level has exploded in recent years.
Measuring Talent Depth
It’s difficult to measure talent across different eras. If it were easy, we wouldn’t have endless talk radio debates and Stephen A. Smith arguing with anyone brave enough to challenge him. With access to better training, medicine, and equipment, I don’t think there is an argument about whether the average NBA player is more talented now compared to 15, 20, or 30+ years ago. But the question still remains whether there is more talent depth, leading to increased levels of competition.
The game is different across generations. The pace, physicality, three-point shot, introduction of analytics into gameplay, and more, all impact the game, making it difficult to measure talent across eras.
Given these facts, we can’t just look at PPG, RPG, APG, shooting percentages, or the eye test to determine the depth of talent in the league today compared to the past. While not perfect, this is where advanced stats can control for differences, such as pace.
Enter Win Shares per 48 Minutes (WS/48) and Box Plus/Minus (BPM). Both WS/48 and BPM are easily accessible and can easily be tracked across eras (unlike some other advanced stats), which makes them ideal for answering questions about talent depth.
To be clear, I’m not ranking individual players—I think it would be a disservice to use these metrics (alone) to do that. However, we can create thresholds and cohorts of players to understand how many players reached certain levels of play.
With that said, here are the all-time leaders in both WS/48 and BPM so you have them for reference. They still pull the most elite players we’ve ever witnessed to the top, which is obviously a good thing when measuring the number of players that achieve certain thresholds based on these advanced stats.
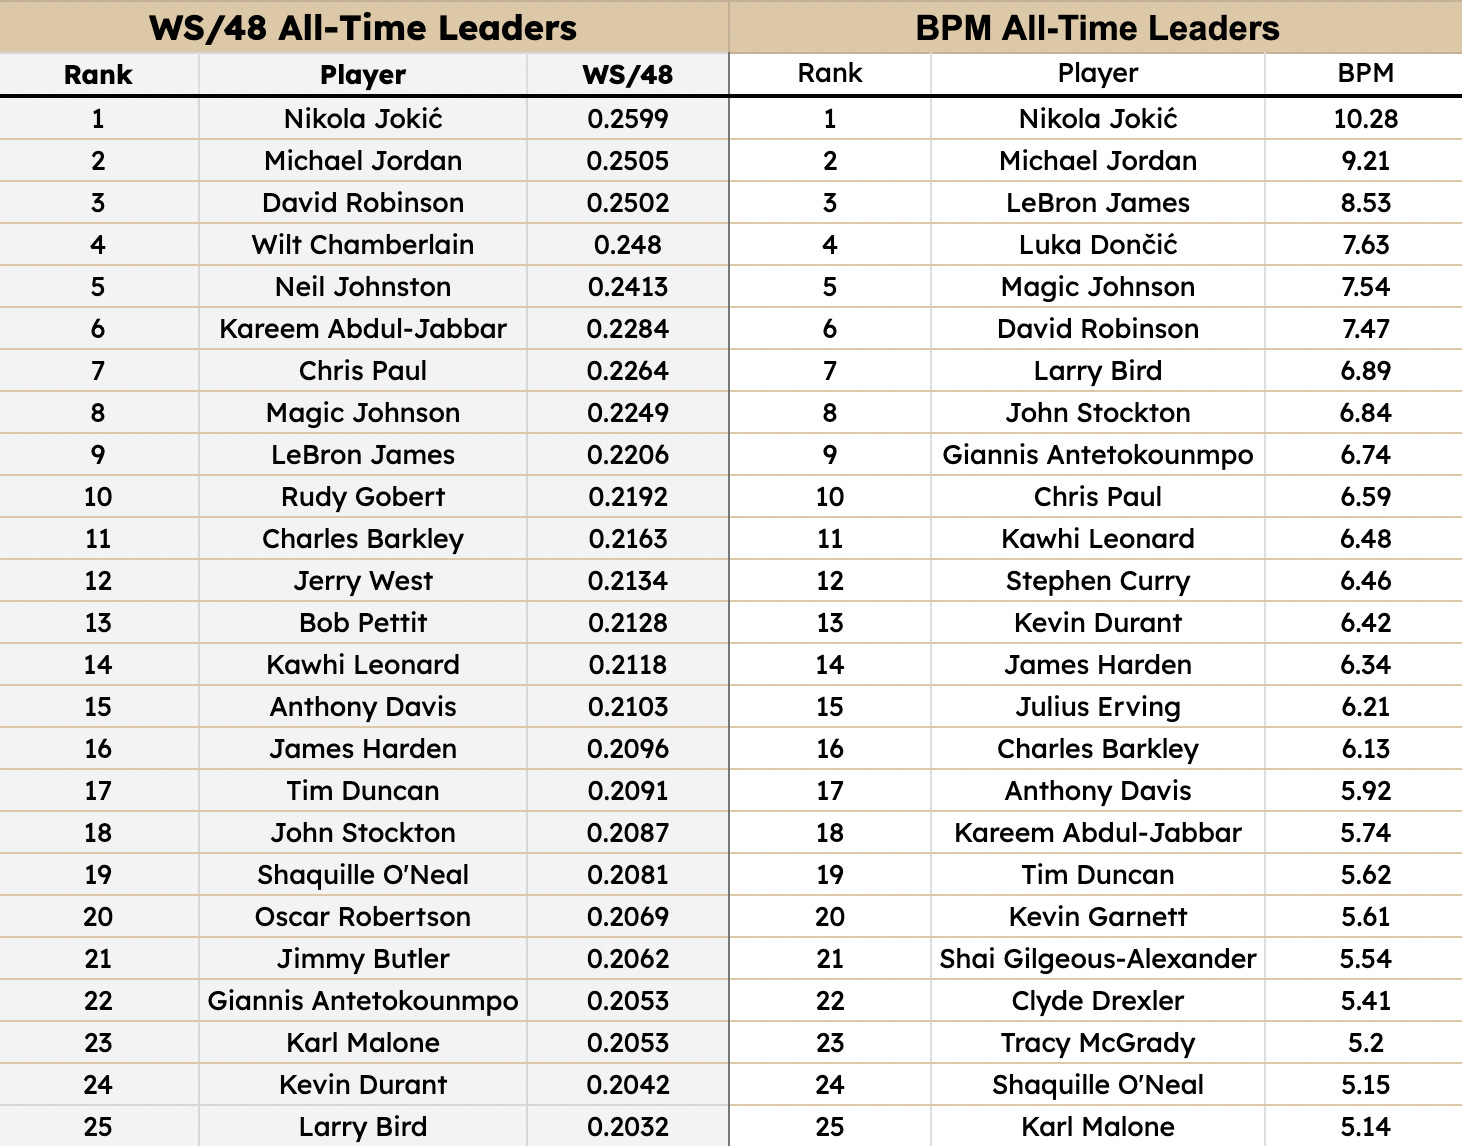
In essence, WS/481 is an estimate of the fraction of a win contributed by a player per 48 minutes. It considers the output offensively and defensively of a player adjusted for the pace of the league, the team, and the scoring rate of players in the league.
BPM2 is a box score-based metric that estimates a basketball player’s contribution to the team when that player is on the court. It is based only on the data available in a traditional box score and ignores data obtained via other means (e.g. deflections).
As mentioned above, I created cohorts of players based on certain levels achieved. The idea is that the number of players reaching certain heights in these two metrics can tell us about the aggregate talent level for a particular season.
I observed the data across the last 30 seasons and removed all players who played less than 500 minutes throughout a season to extract anomalies in the data.
Number of Players Who Had Elite Seasons
The first threshold I looked at was a WS/48 above 0.25 and a BPM greater than 8, both of which indicate elite seasons by individuals. Unsurprisingly, there were never more than six players identified in any one season that achieved these levels.
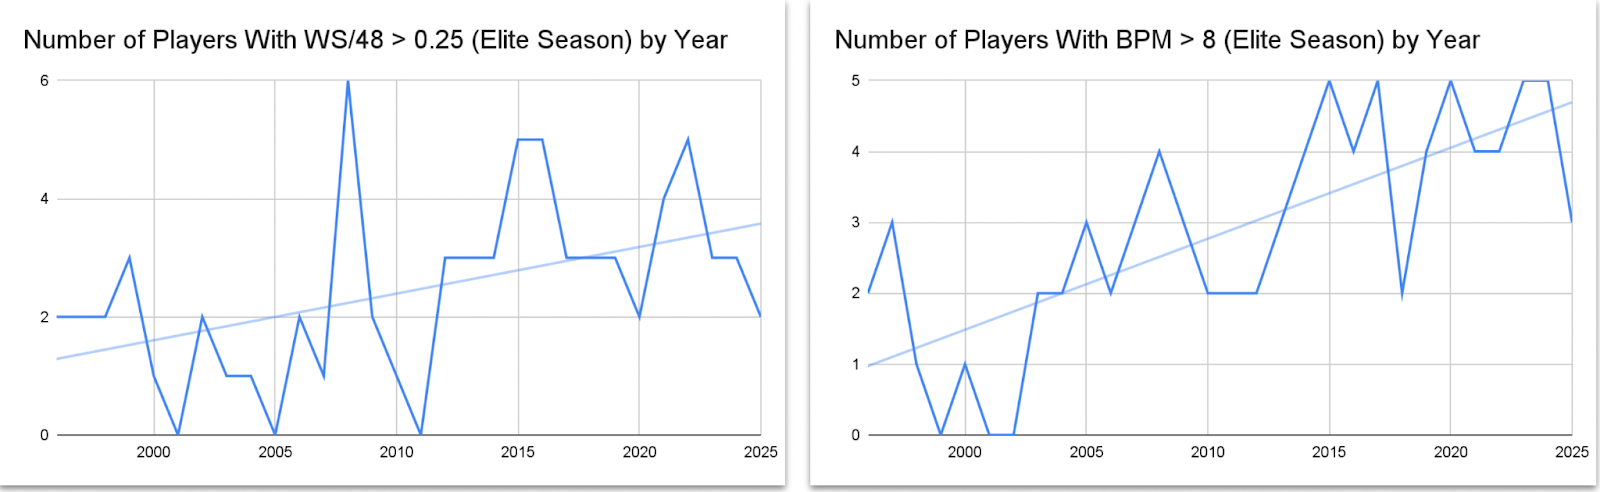
As you can see, there are clear upward trends in the data with the total number of players reaching these thresholds doubling over the last 10 seasons. The low points in the data are in the early 2000s, which fits the narrative that the NBA lacked high-level talent after Jordan’s second retirement.
This suggests there may be more elite players in the Association now, but what about the next tier of players?
Number of Players Who Had Great or Good Seasons
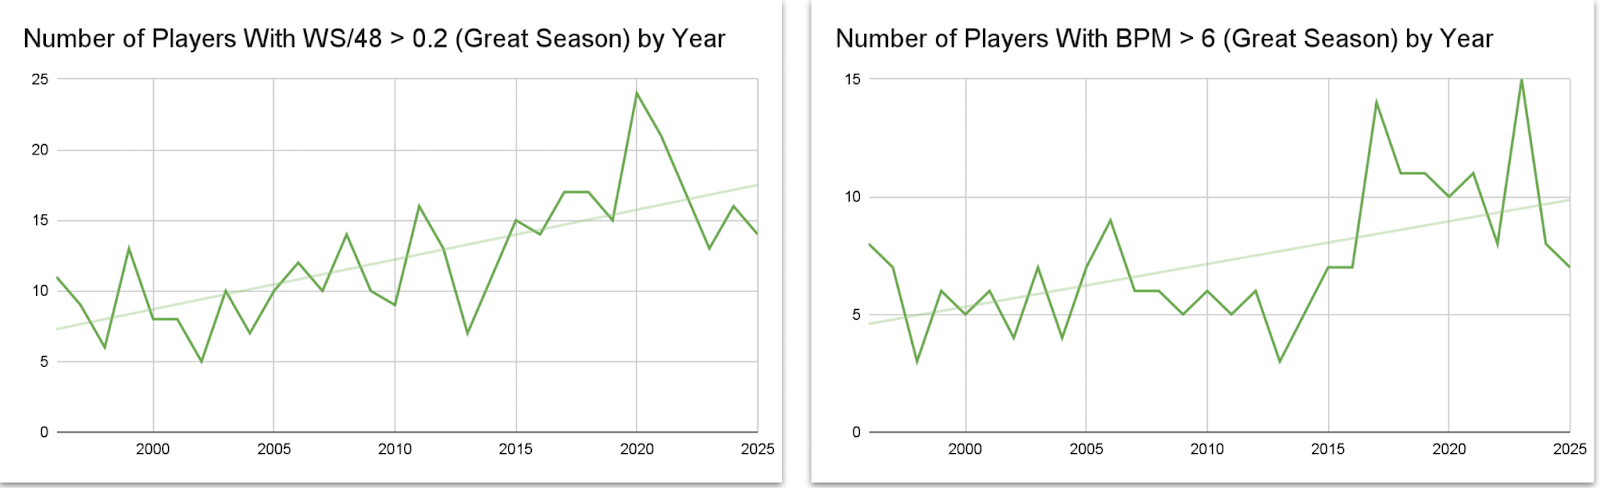

When plotting the data for “great” and “good” seasons, we see a similar upward trend over the last 30 years. WS/48 for players having great seasons has roughly doubled since the early 2000s, whereas BPM was consistent until around 2015. However, now the number of players reaching a BPM greater than 6 has doubled and sometimes tripled since the 2000s and early 2010s. Similarly, the metrics show consistent upward trends for those having “good” seasons (WS > 0.15 & BPM > 2).
Number of Players Who Had Below Average Seasons
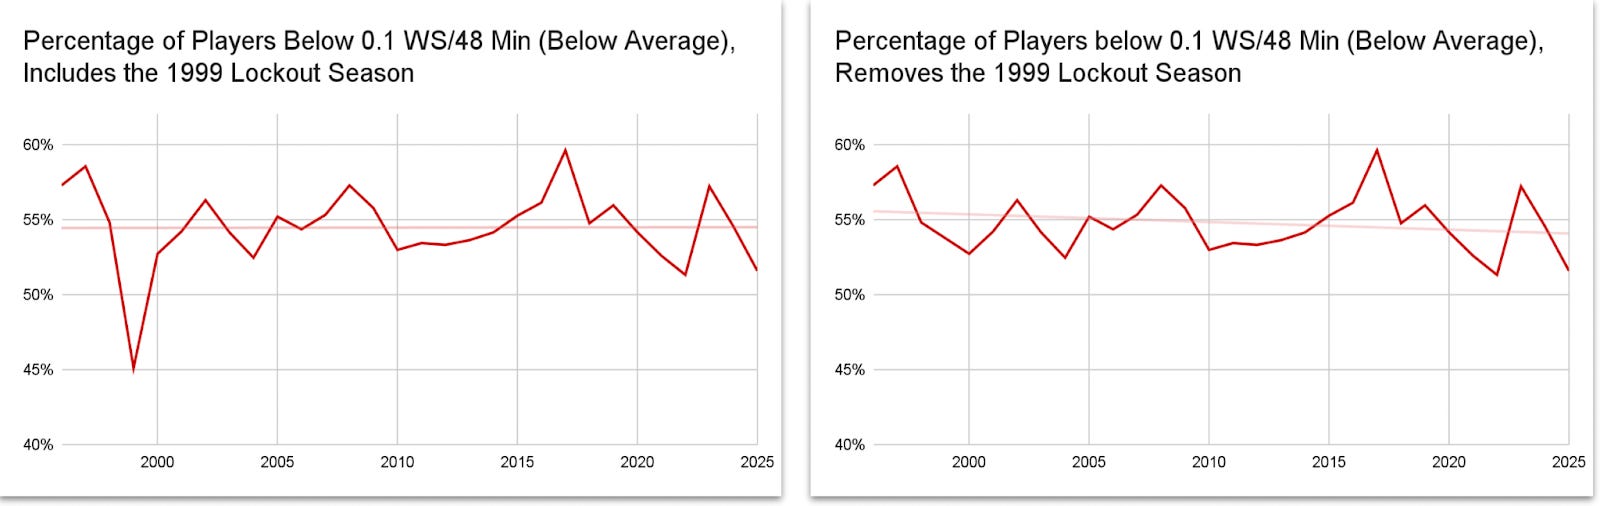
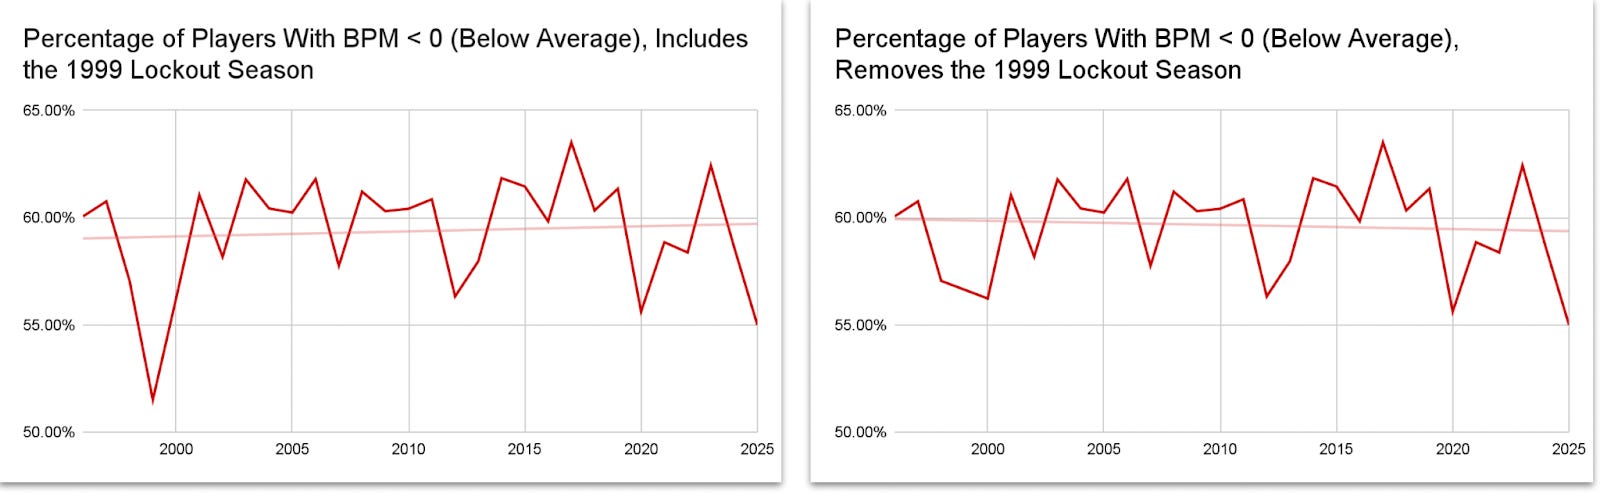
I also looked at the lower half of the league and decided to look at the percentage of the league that was below the league average for both metrics (WS/48 < 0.1 & BPM < 0). The decision to use a percentage was because the number of players who play at least 500 minutes changes each season, and I didn't want that to bias the data.
What I found was that those bucketed in this bottom threshold stayed pretty consistent throughout the last 30 seasons. In some of my cuts, I removed the 1999 season because it was a lockout year in which only 50 games were played. This resulted in only 266 players reaching 500 minutes.
As you can see, once the 1999 season is removed, there is even a slight downward trend in the data, meaning that a smaller percentage of players are meeting this “below average” threshold. This suggests the lower half of the league's talent has been improving. With that said, the trend doesn’t seem strong enough to draw any definitive conclusions.
The Average Output for the Top 150 Players
Based on the data, it appears that there is an argument to be made that the NBA is deeper than it has ever been, especially at the top of the league. To be sure, I observed how the average talent level compared across seasons among key players. I took the average WS/48 and average BPM among the top 150 players and plotted the data across the 30 seasons.
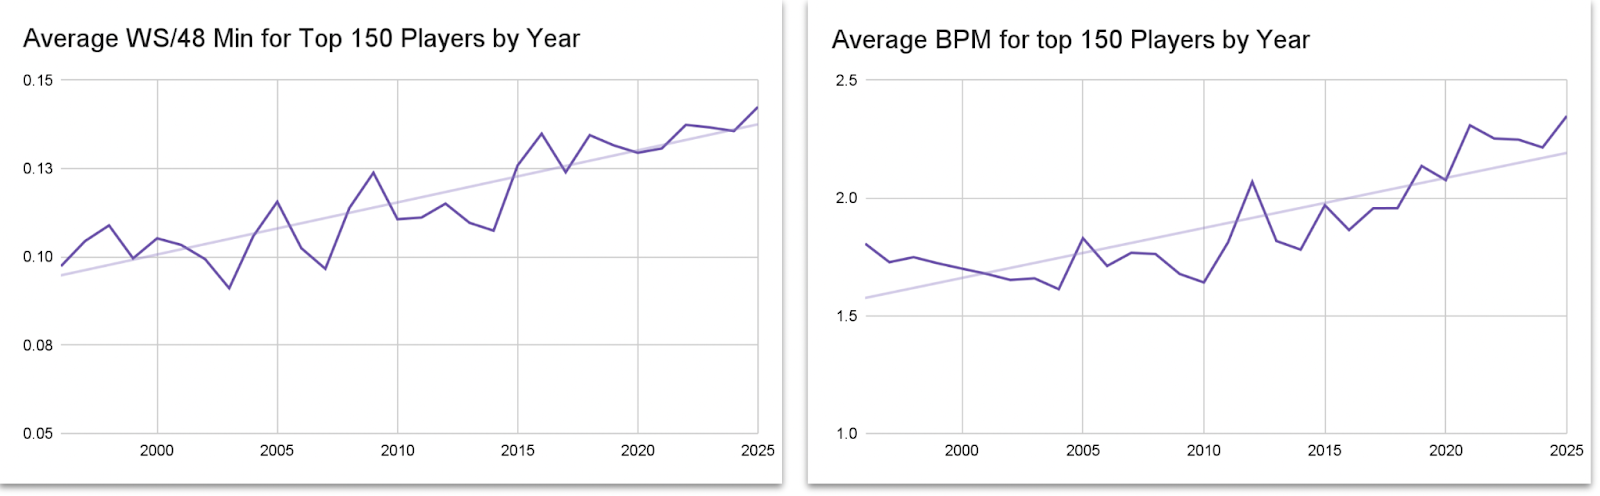
Again, what I found is that there has been an upward trend in the average WS/48 and BPM for the top 150 players since the early 2000s.
I gut-checked some of these findings with Estimated Plus-Minus (EPM)3, which predicts a player’s contributions to the team in points per 100 possessions. Dunks & Threes has an interactive EPM scatterplot that goes back to the 2002 season. If you quickly flip between each season, you will see similar trends to what we see in WS/48 and BPM above—there are more players in today’s game who are hitting higher thresholds.
Kevin Durant’s Opinion Checks Out
What this tells us is that the overall production and efficiency of important players have improved and that the depth of talent in the NBA is probably at an all-time high. At a minimum, the data tells us that there is a higher level of competition, which is likely leading to the parity we see today. I think Kevin Durant is right—this is the peak of the NBA, at least for now.

Win Shares Per 48 Minutes (WS/48)
WS/48 is a metric that divides the credit of team success to individual players. It is an estimate of the number of wins contributed by a player per 48 minutes. It considers the output offensively and defensively of a player adjusted for the pace of the league and team and the scoring rate of players in the league.
WS/48 above 0.2 is considered an elite level of play. WS/48 of 0.1 is considered the league average.
WS/48 also has its limitations. It tends to overvalue starters who play lots of minutes on good teams, even if they aren’t the key contributors. It also undervalues passing and off-ball play. Similar to BPM, it doesn’t give as much weight to defense, so it may not credit defensive-minded players as much as it should.
Box Plus/Minus (BPM)
BPM is a box score-based metric that estimates a basketball player’s contribution to the team when that player is on the court. It is based only on the data available in a traditional box score and ignores information only obtained via other means (e.g. deflections). It uses box score data and the team’s overall performance to estimate a player’s contribution in points above the league average per 100 possessions.
For example, if someone’s BPM is +5.0, that means they contribute five points above the league average per 100 possessions. This is a useful metric because it can be used across eras and each player can be assigned a score.
To give a sense of how the score works, anything above an 8 is considered an elite season. Think MVP-caliber play on the court. Anything around 2 is a good season and 0 is considered the league average. Anything below -2 is considered replacement level.
Like any stat, BPM isn’t without its limitations. Since it relies on the box score, it generally favors offensive stats since it is easier to measure than defense. Post players’ defense also tends to be overemphasized due to their ability to grab more rebounds and blocks.
Estimated Plus-Minus (EPM)
EPM is an all-in-one player metric that predicts a player's contribution to the team in points per 100 possessions. EPM has two main components: 1) a statistical plus-minus (SPM) model that uses highly optimized stats (estimated skills) to estimate a player's contribution per 100 possessions, and 2) a regularized adjusted plus-minus (RAPM) calculation that captures impact beyond the stats.
One key limitation of EPM is that it bakes in expectations based on past performance, which can introduce bias, especially for rookies, players returning from injury, or those in new roles.
Wow!! Why hasn't ESPN. FOX or ABC picked you up yet?? Good work