



Football transfer news is one of the wildest things to witness in sports. Reporting can never be 100% trusted. I find myself having to check Transfermarkt just to make sure I’m not being deceived by a tweet saying a deal is all but done. Just look at how long it took to finalize Yan Diomandé’s transfer to Real Madrid. Or the chaos and ripples that ensued after the Folarin Balogun deal to Everton fell apart. This summer’s transfer window definitely gave me flashbacks to NBA free agency when DeAndre Jordan was held hostage in his own home by his Clippers teammates.
But now that the transfer window has closed, we can all breathe again. Fans and Premier League teams can now focus on winning games. After months of rumors, Fabrizio Romano updates (and online quarrels), the squads are finally set. Well, at least until January.
With Premier League spending seemingly hitting new records every transfer window, it begs the question: Which Premier League teams actually make the best use of their money?
Measuring Spending Efficiency
I collected five seasons of Premier League data1 from 2021/22 through 2025/26. I collected data on transfer fees, player wages, amortization schedules, and Premier League tables. The goal was to compare each club’s spending with the number of points it earned.
To get rid of data that might be misleading, I removed point deductions for club violations to ensure findings were based solely on team spending and play on the field.
I also created a metric called Total Squad Cost, which is basically the added wage bill and amortized player transfer costs per year for each club. Adding these two numbers gives us a more accurate view of what the cost of a team actually is for a given year.
I then created a regression estimating how many points a club should earn based on its Total Squad Cost. A team with an expensive squad is expected to earn more points than a team working with a smaller budget. The difference between the model’s estimate and the club’s actual points became its Points Above Expected (PAE).
For example, if a club’s spending suggests it should earn 55 points, but it actually earned 60 points, it has a PAE of +5. If the same club earns 50 points, it has a PAE of -5.
I also had a multi-season ranking that compared the average PAE across the five seasons being observed. To reduce noise, a club had to play at least three of the five seasons analyzed in the Premier League to be considered in the multi-season ranking. There were 21 eligible teams for this ranking across the five seasons.
With that said, let’s get to the rankings.
The Most Efficient Spenders
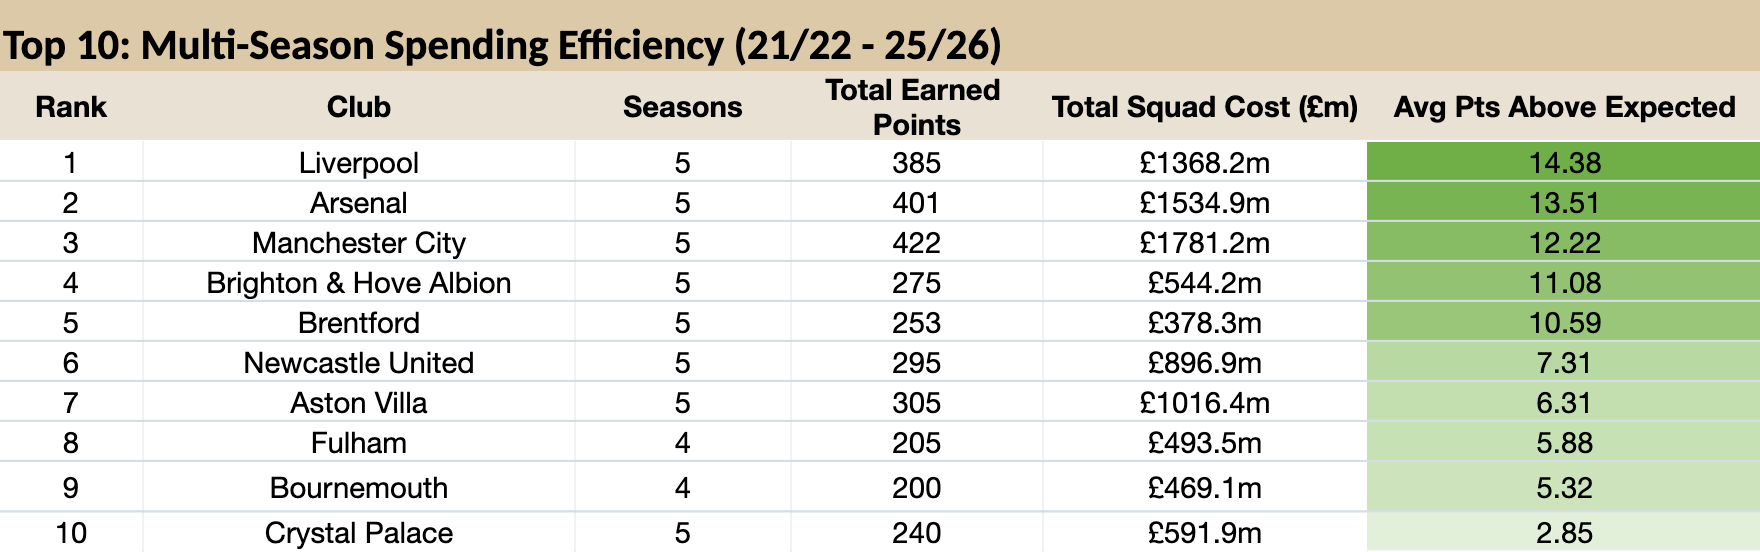
When it comes to efficiency, it’s natural to think less spending is better. However, with the PAE metric, spending is ok as long as the team produces results on the field. Over the last five seasons, nobody has done that better in the Premier League than Liverpool.
Liverpool averaged a PAE of 14.38. Across the five seasons, Liverpool earned 385 points and had the two most efficient individual seasons. It finished 26.13 points above expected in 2021-22 and 26.2 points above expected in 2024-25.
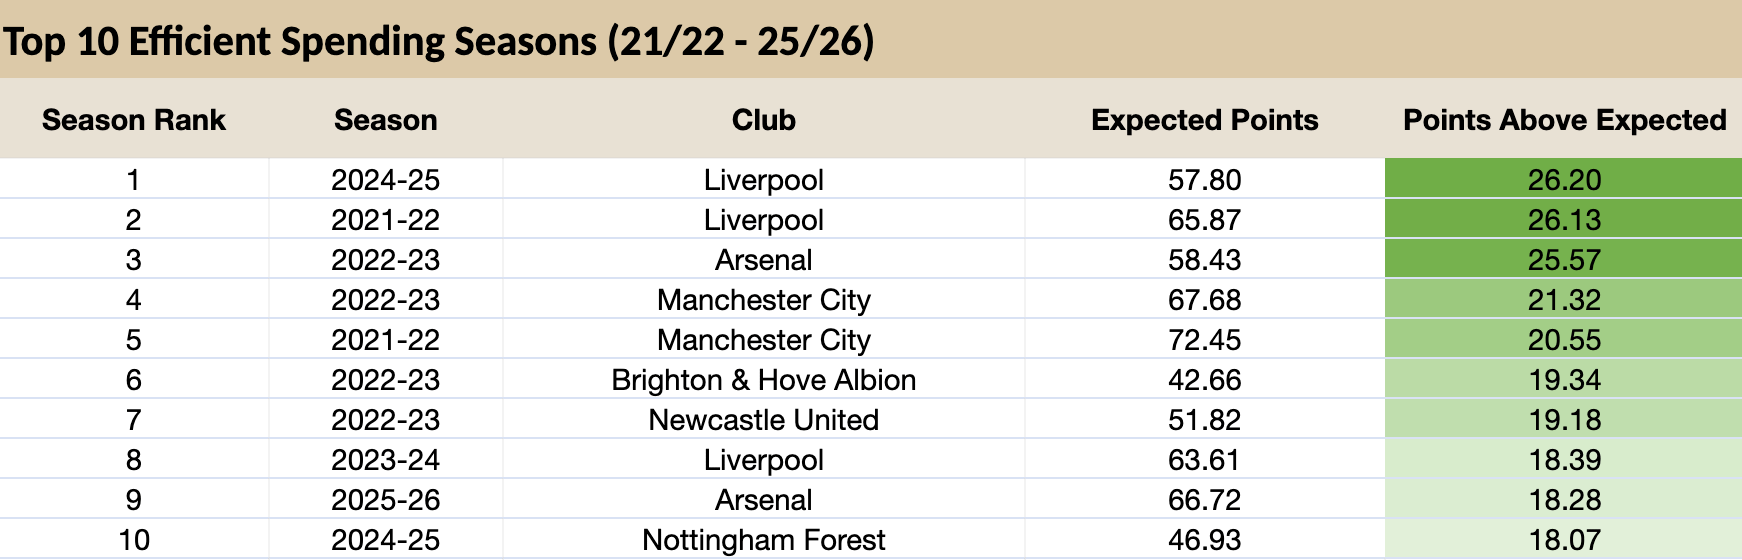
Funnily enough, Liverpool actually underperformed its PAE last season by 4.7 points, but still finished on top over the five years because they performed so well the other four. And if you think about the context, it makes sense. They brought in Florian Wirtz and Alexander Isak for a combined £225 million plus add-ons during a season when the team finished far below expectations.
Arsenal finished second with an average of 13.51 PAE over the last five years. Remember when Arsenal’s transfer strategy was regularly mocked? The team was criticized for overpaying for players like Martin Ødegaard and Kai Havertz, but those signings have paid off handsomely.
Like Liverpool, Arsenal have been big spenders over the past five years. But again, smart signings have helped the team outperform its points expectations.
Efficient With Less
Brighton and Brentford are as efficient as advertised. They both beat their Total Squad Cost expectation by 11.08 points and 10.59 points per season, respectively. Brentford produced 6.69 points for every £10 million of Total Squad Cost, the best rate among all 21 qualifying clubs. Both clubs are world-class at finding players before their prices exploded. They have also been willing to sell at the right time and put the profits back into squad building.
The Bottom of the Efficiency Table
Now for the other end of the table. Close your eyes and cover your ears, United fans.
Manchester United averaged 115.09 points below expected per season over the last five years. Only Southampton performed worse among clubs with at least three seasons in the Premier League since the 2021/22 season.
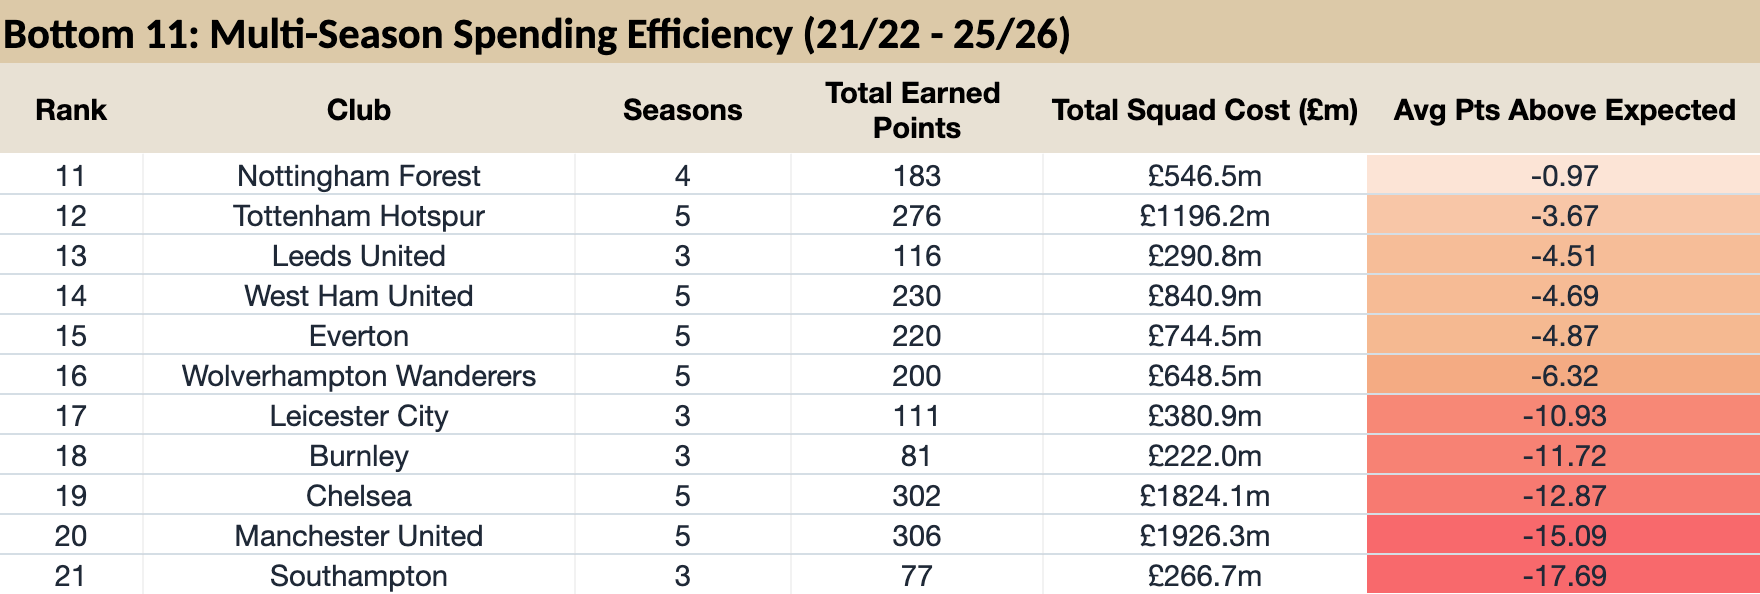
According to our data, United accumulated the highest Total Squad Costs in the Premier League during the time period observed. The Red Devils earned 306 points. For comparison, Aston Villa earned 305 points, and Newcastle earned 295 points, both while spending approximately £1 billion less in Total Squad Costs. United pays like an elite squad and receives results that look much closer to a mid-table team.
Interestingly, transfers aren’t Manchester United’s biggest issue. When looking at just the money spent in the transfer market, United actually outperformed its expected points by 3.3.
However, looking at wage spending alone tells a much different story. United earned nearly 16 fewer points per season than its payroll suggested it should, which heavily impacts its Total Squad Cost metric. One bad transfer window can be overcome, but the issue with United has been the accumulation of expensive decisions.
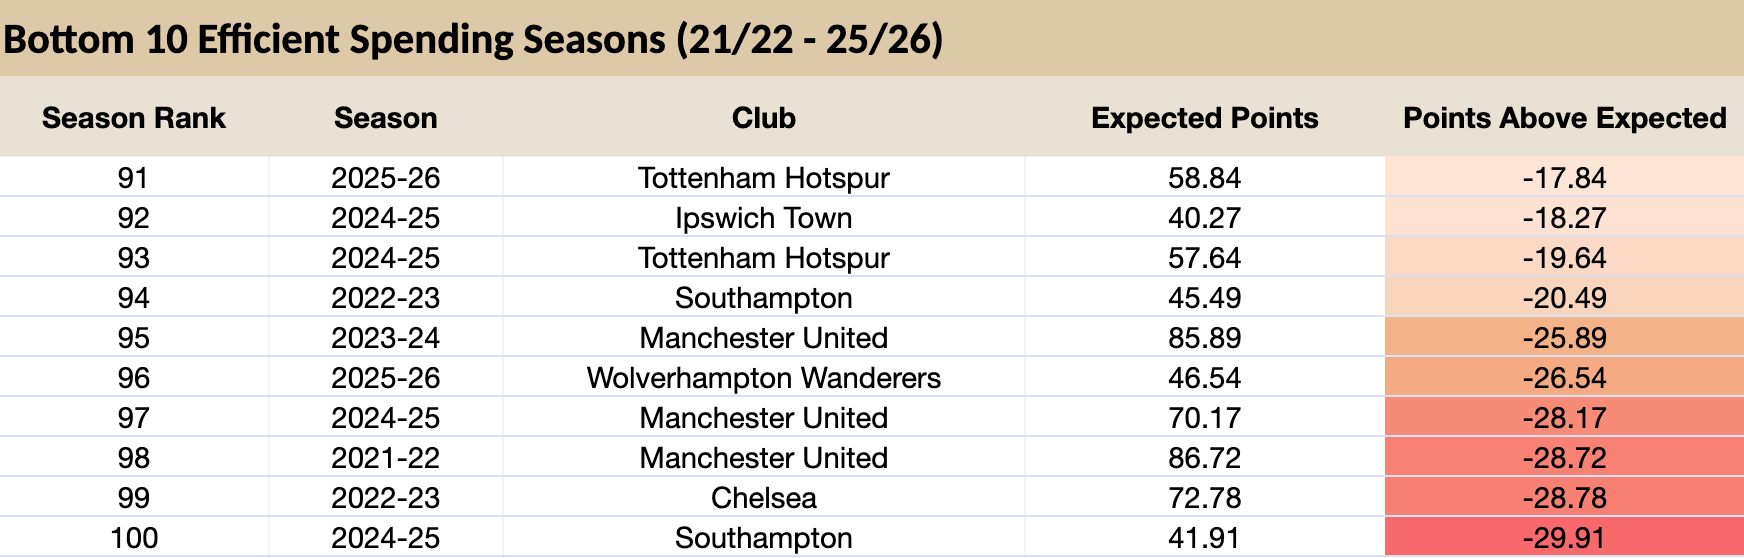
Years of large contracts make life difficult when it comes to efficient spending. And once bad contracts start accumulating year after year, it is hard to break the cycle. As a result, United claimed three of the six worst seasons when it came to points below its expected totals.
Another big club underperforming is Chelsea. Chelsea is a club that has spent big over the past five years in the hopes its youth movement will pay off. It hasn’t, at least not yet.
Chelsea finished 12.87 points below expected, placing it 19th in the table out of the 21 teams that qualified. The difficulty with evaluating Chelsea is that much of its spending was designed around young players and unusually long contracts. This summer’s transfers for Chelsea may be a turning point. Time will tell.
The Challenge For Promoted Clubs
Newly promoted clubs only averaged 31.2 points per season over the five years analyzed and finished over eight points below their PAE. Contrast that with established Premier League clubs, who averaged 56.2 points and finished 1.48 points above expected.
So, why does this happen?
Newly promoted clubs often have to rebuild large portions of their squad in one summer. They are buying several players at once and integrating them quickly. They often have a lot of spending to do, yet they are often still recruiting players on the fringes. In other words, they are spending a lot, but the quality of the players may not be there since the best are choosing to go to established Premier League teams.
Just look at the recently promoted teams’ spending this summer. According to Transfermarkt, Ipswich spent £189.56m (8th highest in the Premier League), Hull spent £150.9m (10th highest), and Coventry spent £127.6m (12th highest) to try and bolster their squad to stay up this year.
Even despite these efforts, most recently promoted teams eventually drop back down to the Championship. It’s no wonder none of the top 10 individual PAE seasons over the last five years include recently promoted clubs, but two promoted clubs are included in the bottom 10 PAE seasons.
Transfer Spending Tells Us Less Than We Think
One of the most interesting findings came from comparing transfer spending, wages, and Total Squad Cost. In 2022/23 and 2024/25, transfer spending explained less than one percent of the variation in club points. We spend all summer tracking and commentating on transfer fees, yet the amount spent in a single window tells us very little about what will happen during the season.
Wages, on the other hand, were much more closely related to results. Transfer spending captures the players purchased during a specific period. However, wages capture the perceived quality of the squad.
What the Data Tell Us
Transfer windows are easy to sell to fans and the powers that be. Give a manager new talent and every weakness from last season is seemingly answered. The record signing will propel the team up the table. The cheap prospect is the next great scouting find. Then the matches begin, and everyone has to prove that the moves made during the transfer windows were the correct ones.
Liverpool spent plenty, but the spending kept producing points. Arsenal received criticism during its rebuild, particularly when some of its signings seemed questionable, but stuck with it year after year and won the title. Manchester City faced the highest expectations in the league and still found a way to exceed them.
Teams like Brighton and Brentford are forced to take a different path. They can’t compete with the biggest clubs financially, so they have to find advantages elsewhere. They have to reach players before the wealthier clubs do. Some develop into first-team contributors. Some outgrow the club and are sold, funding the next group of prospects. The cycle has to continue because clubs like Brighton and Brentford can’t afford many mistakes before relegation breathes down their necks.
Clubs near the bottom of the PAE ranking tell another story. Manchester United didn’t arrive there because of one bad signing. United’s position reflects several years of expensive decisions. The manager responsible for a signing may be gone within a season, but the transfer cost and salary remain. Bad signings can be sold, but often for a loss. And this is what makes squad building so difficult. The next transfer window begins with less flexibility because of decisions made several years earlier.
The consequences of poor spending for teams with lots of money like Manchester United and Chelsea usually are a season without European football. However, consequences aren’t so kind to smaller clubs like Brighton and Brentford. Four of the bottom 10 PAE seasons in the dataset resulted in teams being relegated, and they all happened to teams with limited money to spend.
Every August, we rush to declare winners and losers before most of the new signings have even played for their new team. It is part of what makes the transfer window fun. But now the transfer window is closed, at least for a few months. And we’re left with what matters: turning money into points.
The wage figures are estimates from fbref.com and capology.com. They shouldn't be treated as audited club payroll expenses. Player amortization comes from kinnairdsports.com, deloitte.com, and published club accounts where available. For club seasons without published figures, I estimated the annual charge using previous amortization and current incoming transfer fees. Some transfer fees were undisclosed. Transfer fees come primarily from Transfermarkt, supplemented by credible press reports for some undisclosed deals. Add-ons, loan fees, and agent fees are excluded. Reported transfer totals may therefore understate the real cost of certain deals. League tables, promotion/relegation, and point deductions were pulled from premierleague.com. PAE should be interpreted as a descriptive measure of how efficiently a club converted spending into points, not a causal relationship. AI was used in data collection and analysis/synthesis.
Excellent piece! For the top spots, I think it all comes down to what Liverpool is doing so well—efficiently combining big investments with smart signings that help the team outperform its points expectations.
I was surprised by the bottom of the list, as my intuition assumed Chelsea would be worse than Man Utd, but that’s not the case. As you mentioned, the combination of expensive decisions and poor performance degrades the index. Chelsea seems to be worsening their situation with those long-term contracts.