


The NBA season is back! In basketball, a single player can change the trajectory of a season probably more than any other team sport. And there are few things more frustrating than watching your team give away a lead while its best player sits on the bench. It’s an easy decision from the couch, but coaches oftentimes stick to their normal rotations, even when things are going poorly.
Making playing time decisions is hard. And so much has been said in recent years about the impact of too many minutes played in today’s NBA. If you are interested in the topic of injuries, go read my articles on load management and Achilles injuries.
In this article, I explore regular season and playoff minutes across the last ten NBA seasons, from 2016/17 through 2025/26, along with earlier career data of select players. I look at trends in playing time for starters and bench players, how coaches allocate minutes differently, and compare minutes played among prominent NBA players.
Regular Season Minutes
Every team has the same 240 player-minutes to distribute in a game. Five players on the court multiplied by 48 minutes.
Across 82 games, those minutes have several things they need to do. They have to help win the game, give younger players room to develop, cover for injured teammates, and identify which combinations work best. The season is a marathon, but managing a roster is a jigsaw puzzle.
To understand who gets those minutes, I ranked each team’s players by total playing time and calculated the share going to its top five players and top eight players. A smaller percentage of the allocated minutes during the season is being given to the top five and top eight players for each team in recent years compared to years past.
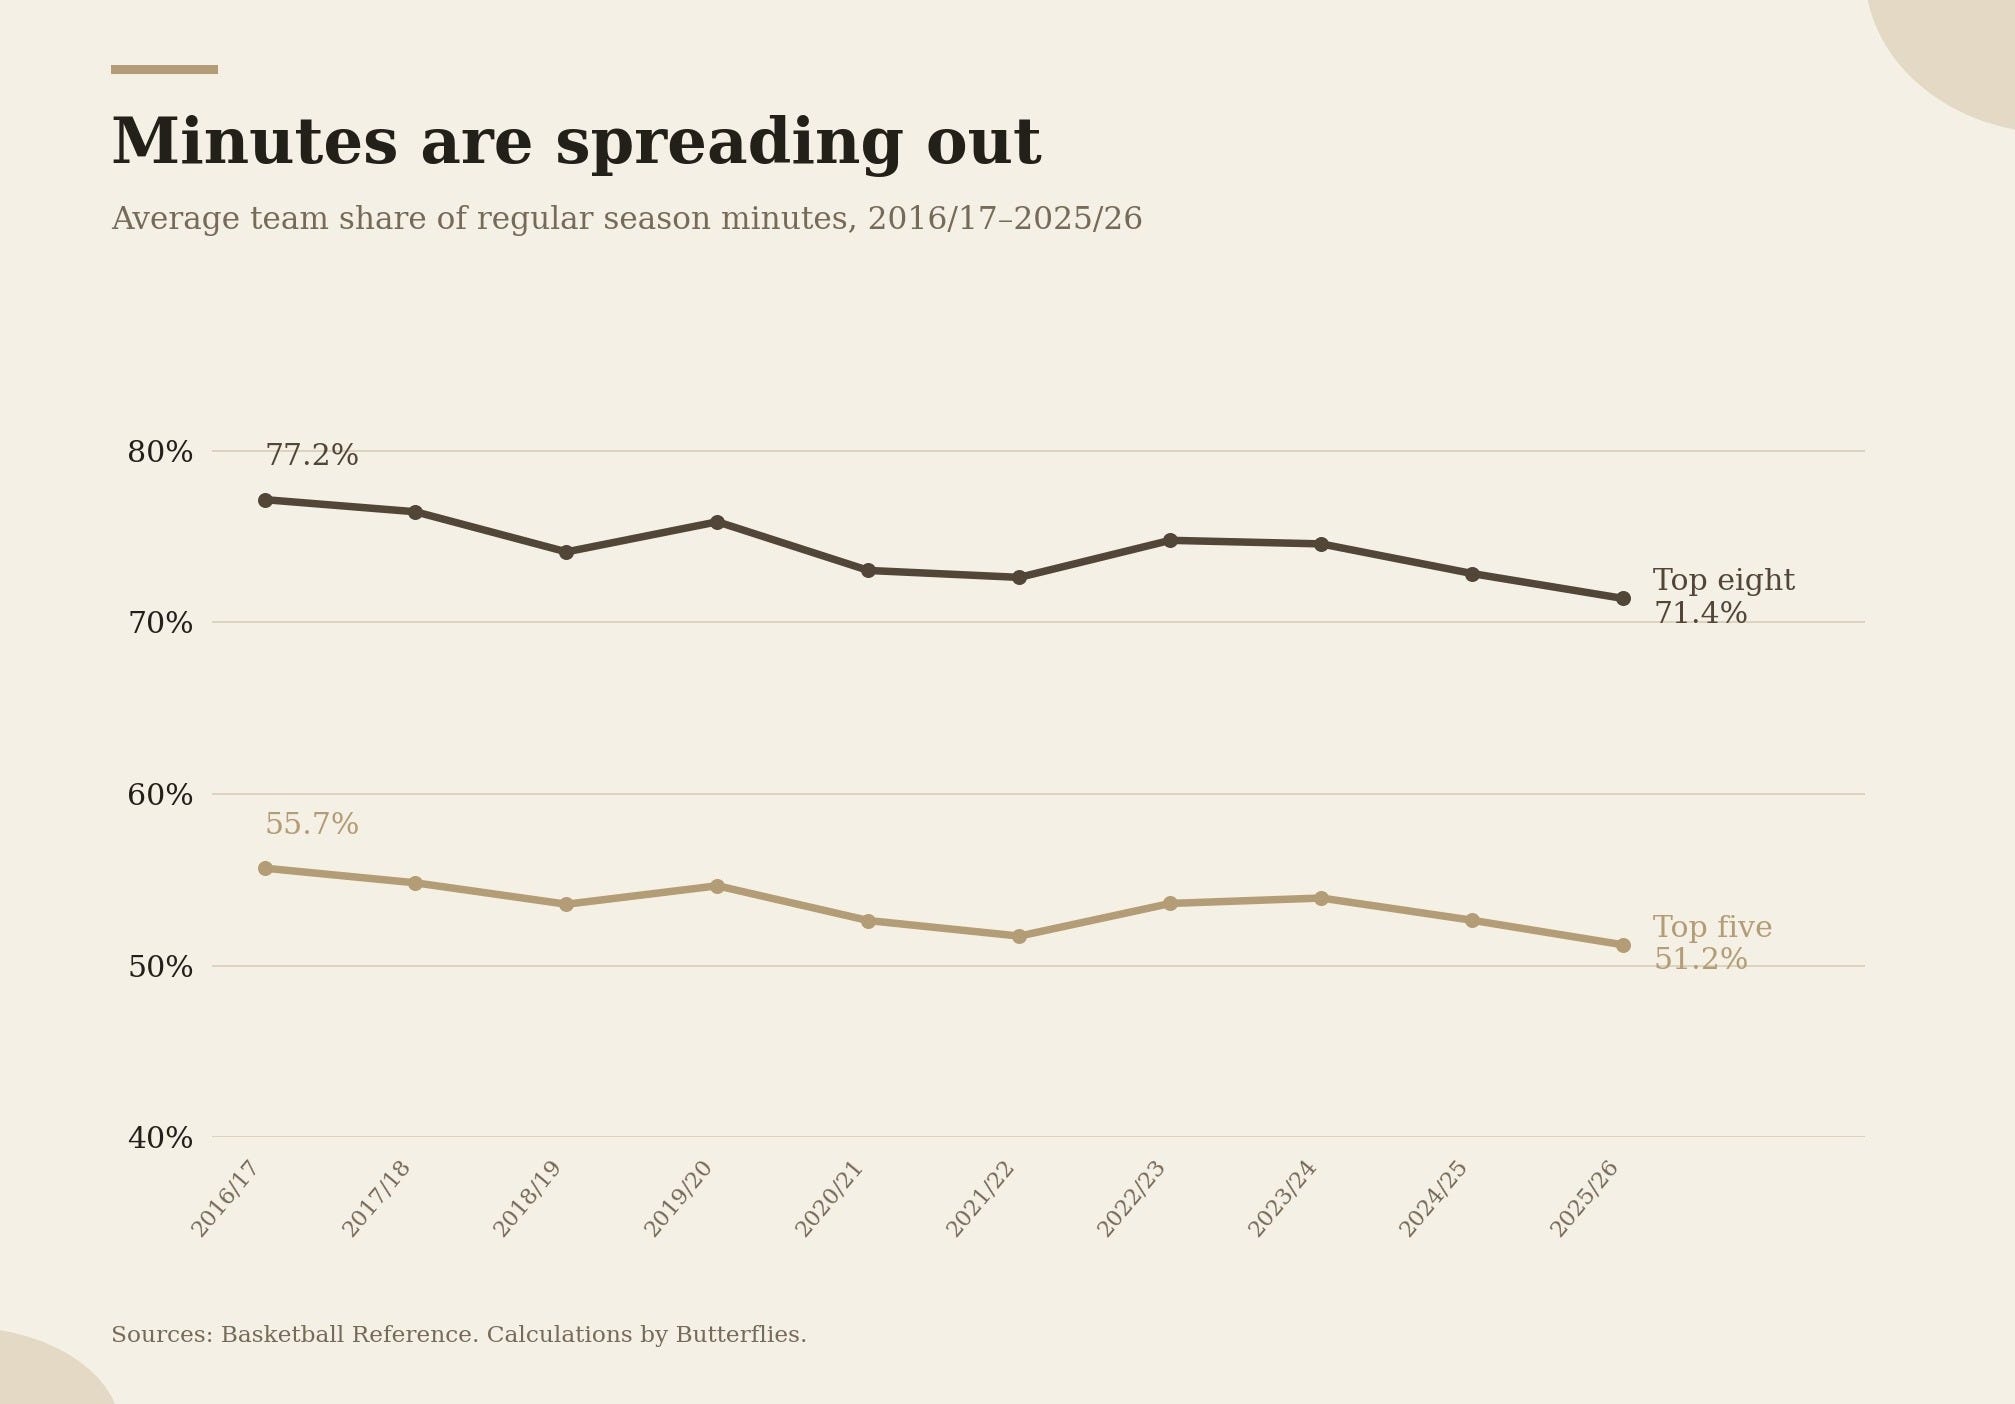
Meanwhile, the number of players who appeared in a regular season game increased from 486 in 2016/17 to 582 in 2025/26. There are a few explanations for a larger number of players getting minutes, the most likely contributors being larger rosters, injuries, and tanking.
Let’s start with the roster itself. In 2016/17, teams could carry up to 15 players on standard NBA contracts. The following season, the league added two two-way spots per team. A third two-way spot was added in 2023/24.
Across 30 teams, that raised the usual combined capacity from 450 to 540 roster spots, a 20% increase. Not surprisingly, the number of players who appeared in our sample jumped from 486 to 541 in the first season with two-way contracts.
Injuries create another kind of opening. A third-party analysis showed that 4,198 regular season games were lost to injury or illness in 2016/17. By 2024/25, that figure had reached 6,779. That’s about a 61% increase, which outpaces the percentage increase in players who received playing time. This can also account for the increase in playing time across more players.
Then there’s tanking. Eight teams in 2025/26 won no more than a third of their games, compared to three in 2016/17. The eight teams that won less than a third of their games last season gave their top eight players an average of 64.4% of their season minutes. The other 22 teams allocated, on average, 73.9% of their minutes to their top eight players.
The number of teams that win less than a third of their games goes up and down over the decade rather than increasing every year. However, the NBA has made a concerted effort to reduce tanking, which gives us more qualitative evidence of it being more of a problem in recent years compared to years past.
In February 2026, the NBA fined the Utah Jazz $500,000 after Lauri Markkanen and Jaren Jackson Jr. were removed before the fourth quarter in two close games despite being able to continue. Indiana received a separate $100,000 fine after holding out three starters who the league determined could have played. Then there’s the change in the lottery rules, which give the teams with the worst three records a lower chance of getting a top pick in the draft.
What likely explains the growing spread of minutes is a combination of all three: larger rosters, an increase in injuries, and more tanking.
Playoff Minutes
Incentives change when determining minute allocations once there is a specific opponent to beat, and elimination is at stake. There is less room to spend minutes on developing potential. The minute distributions show how much more concentrated the work becomes.
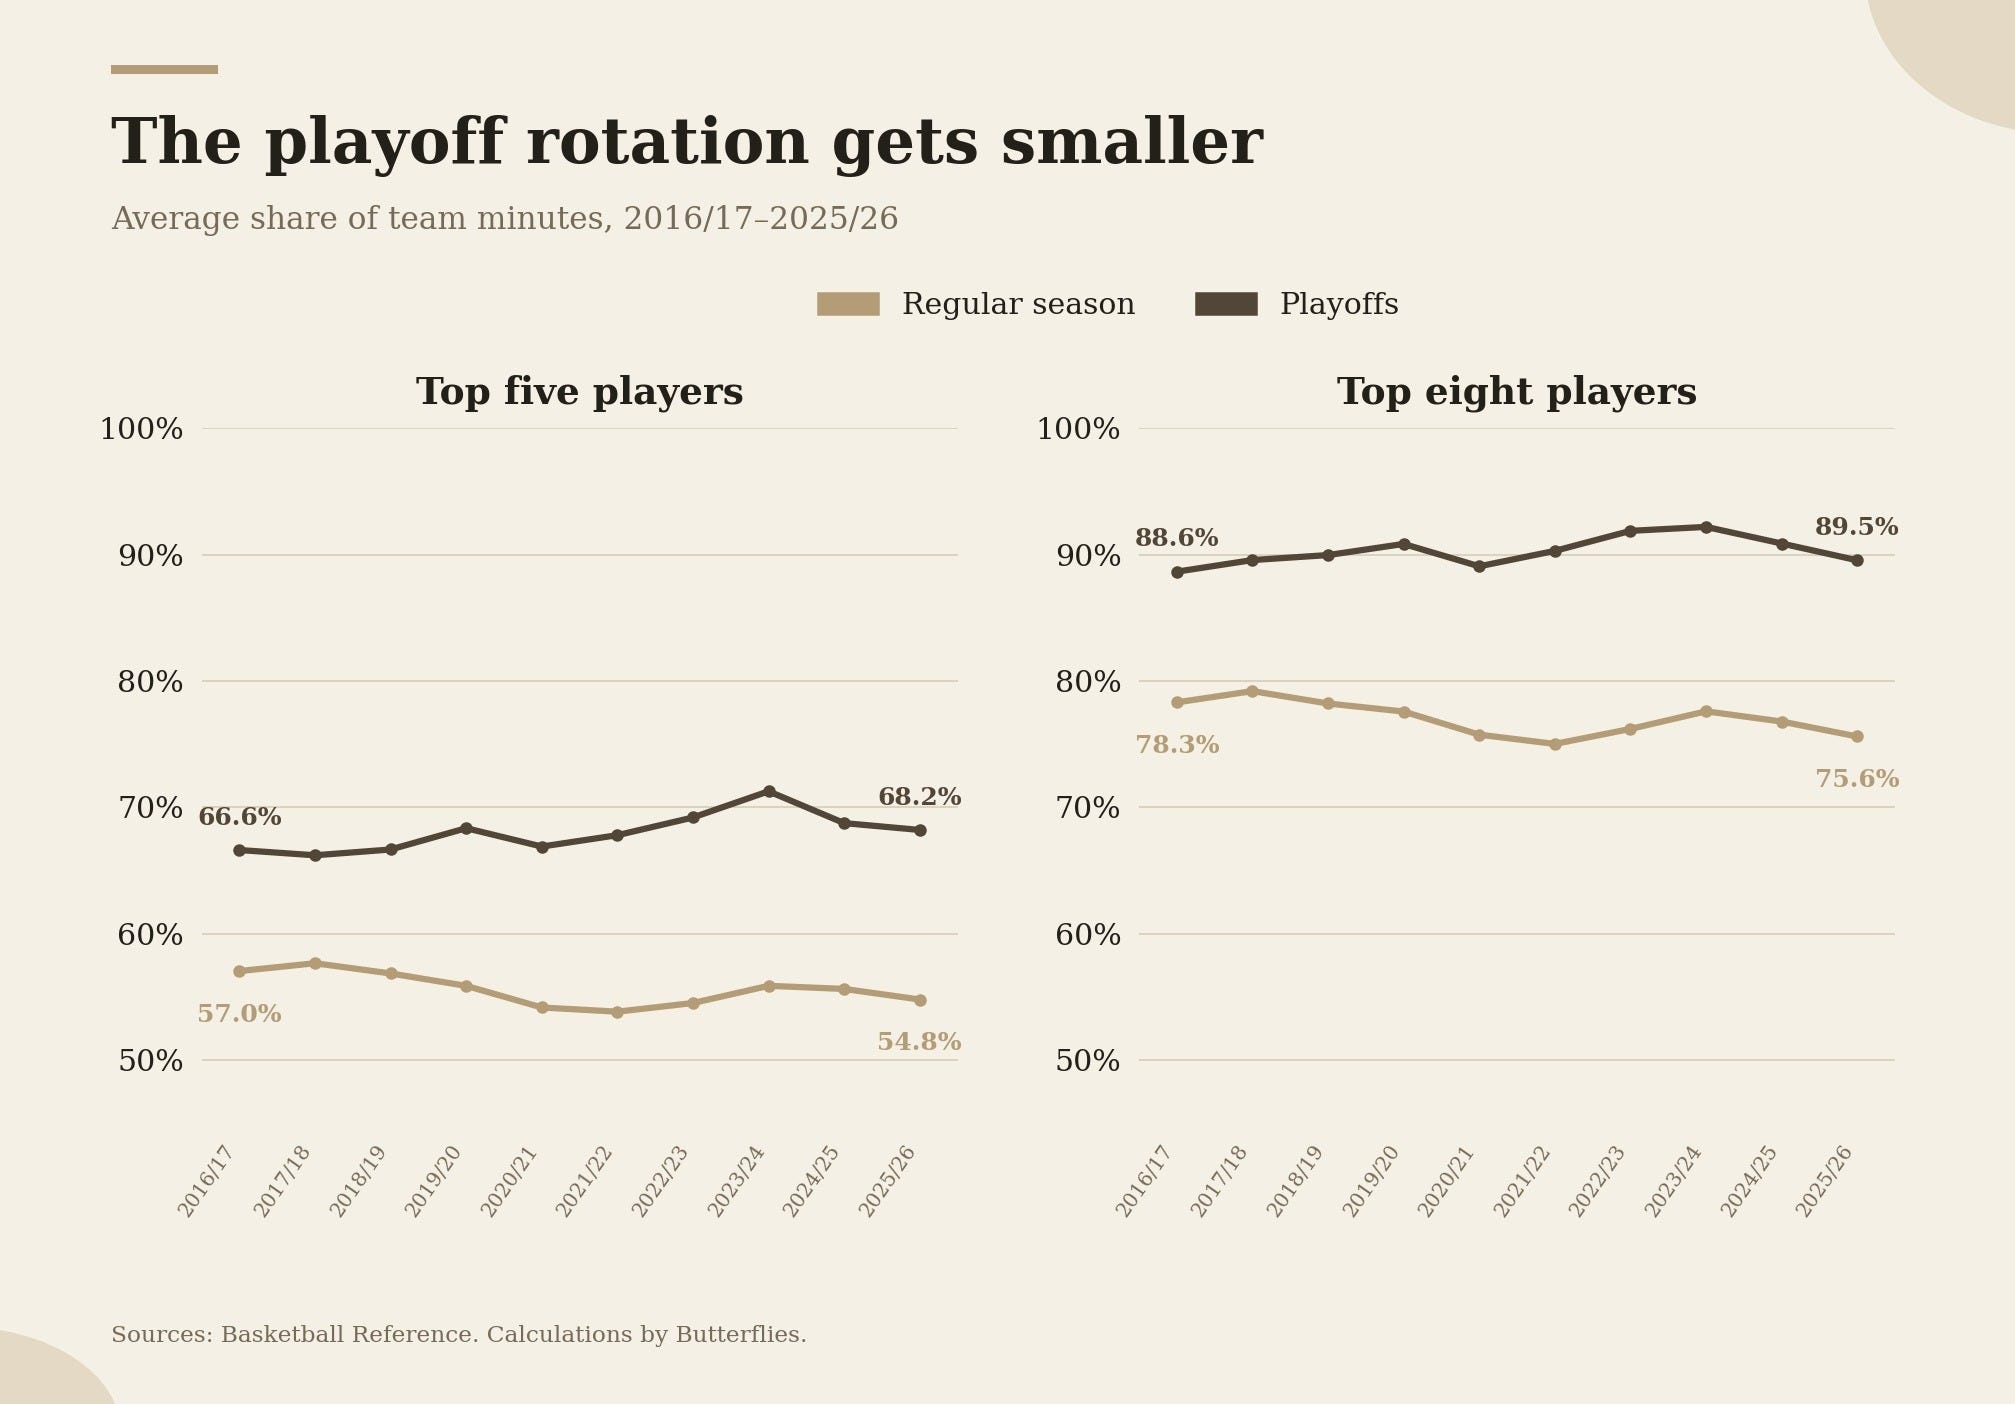
Averaged across all ten seasons, the 16 playoff teams each year gave their top eight players 77% of regular season minutes and 90.3% of playoff minutes. The graph below shows those averages season by season. In 2025/26, for example, the share of minutes among a team’s top eight players rose from 75.6% to 89.5%. All 160 playoff team-seasons showed an increase in minutes among its top eight players.
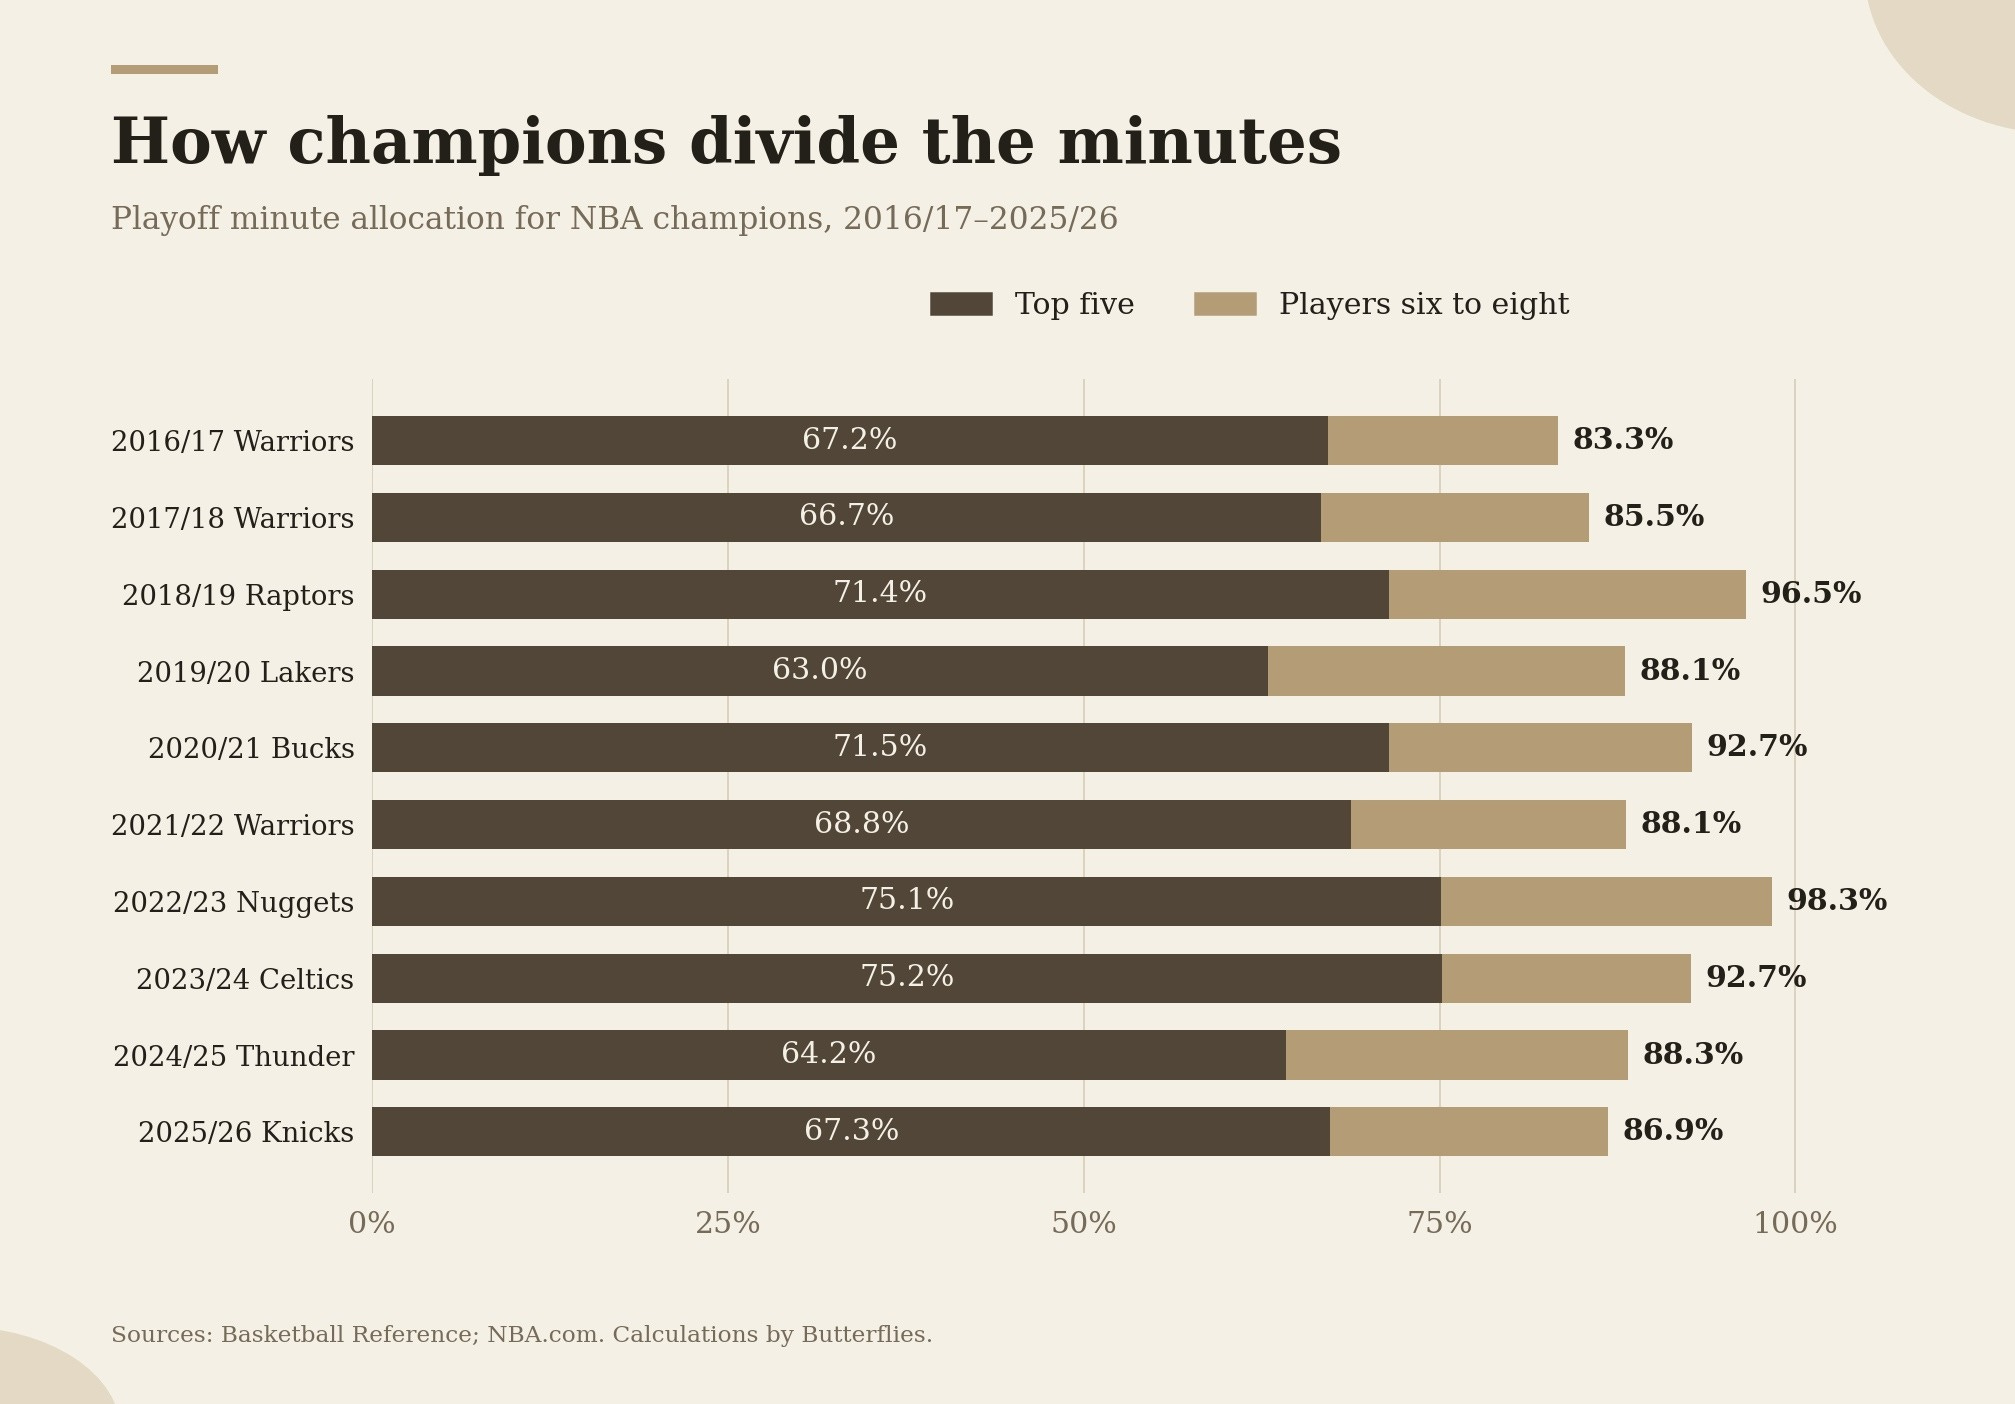
That leaves everyone outside the top eight sharing less than 10% of postseason minutes, on average. Denver took this to an extreme during its 2023 championship run. Its eight most-used players accounted for 98.3% of the team’s playoff minutes.
Interestingly enough, across all ten champions, the average was 90.0%, which is about the same as the other playoff teams. Championship teams weren’t outliers in terms of allocating playing time to their best players. Their top eight players were just outperformed everyone else’s.
This is what makes roster depth an interesting thing to study. A roster can give a team enough options to get through the regular season without every option remaining useful in a playoff series. The goals and incentives change as the season enters the Spring, and the coach better be prepared to make the right decisions.
How Coaches Distribute Minutes
The coach has a lot to do with how opportunities are distributed. I compared minute allocations across coaches over the ten-season sample.
For this comparison, I only included team-seasons when a coach was with a single team the whole year. I averaged each team’s top-five and top-eight shares across that coach’s qualifying seasons. The chart ranks the ten coaches with the highest average top-eight player share of regular season minutes.
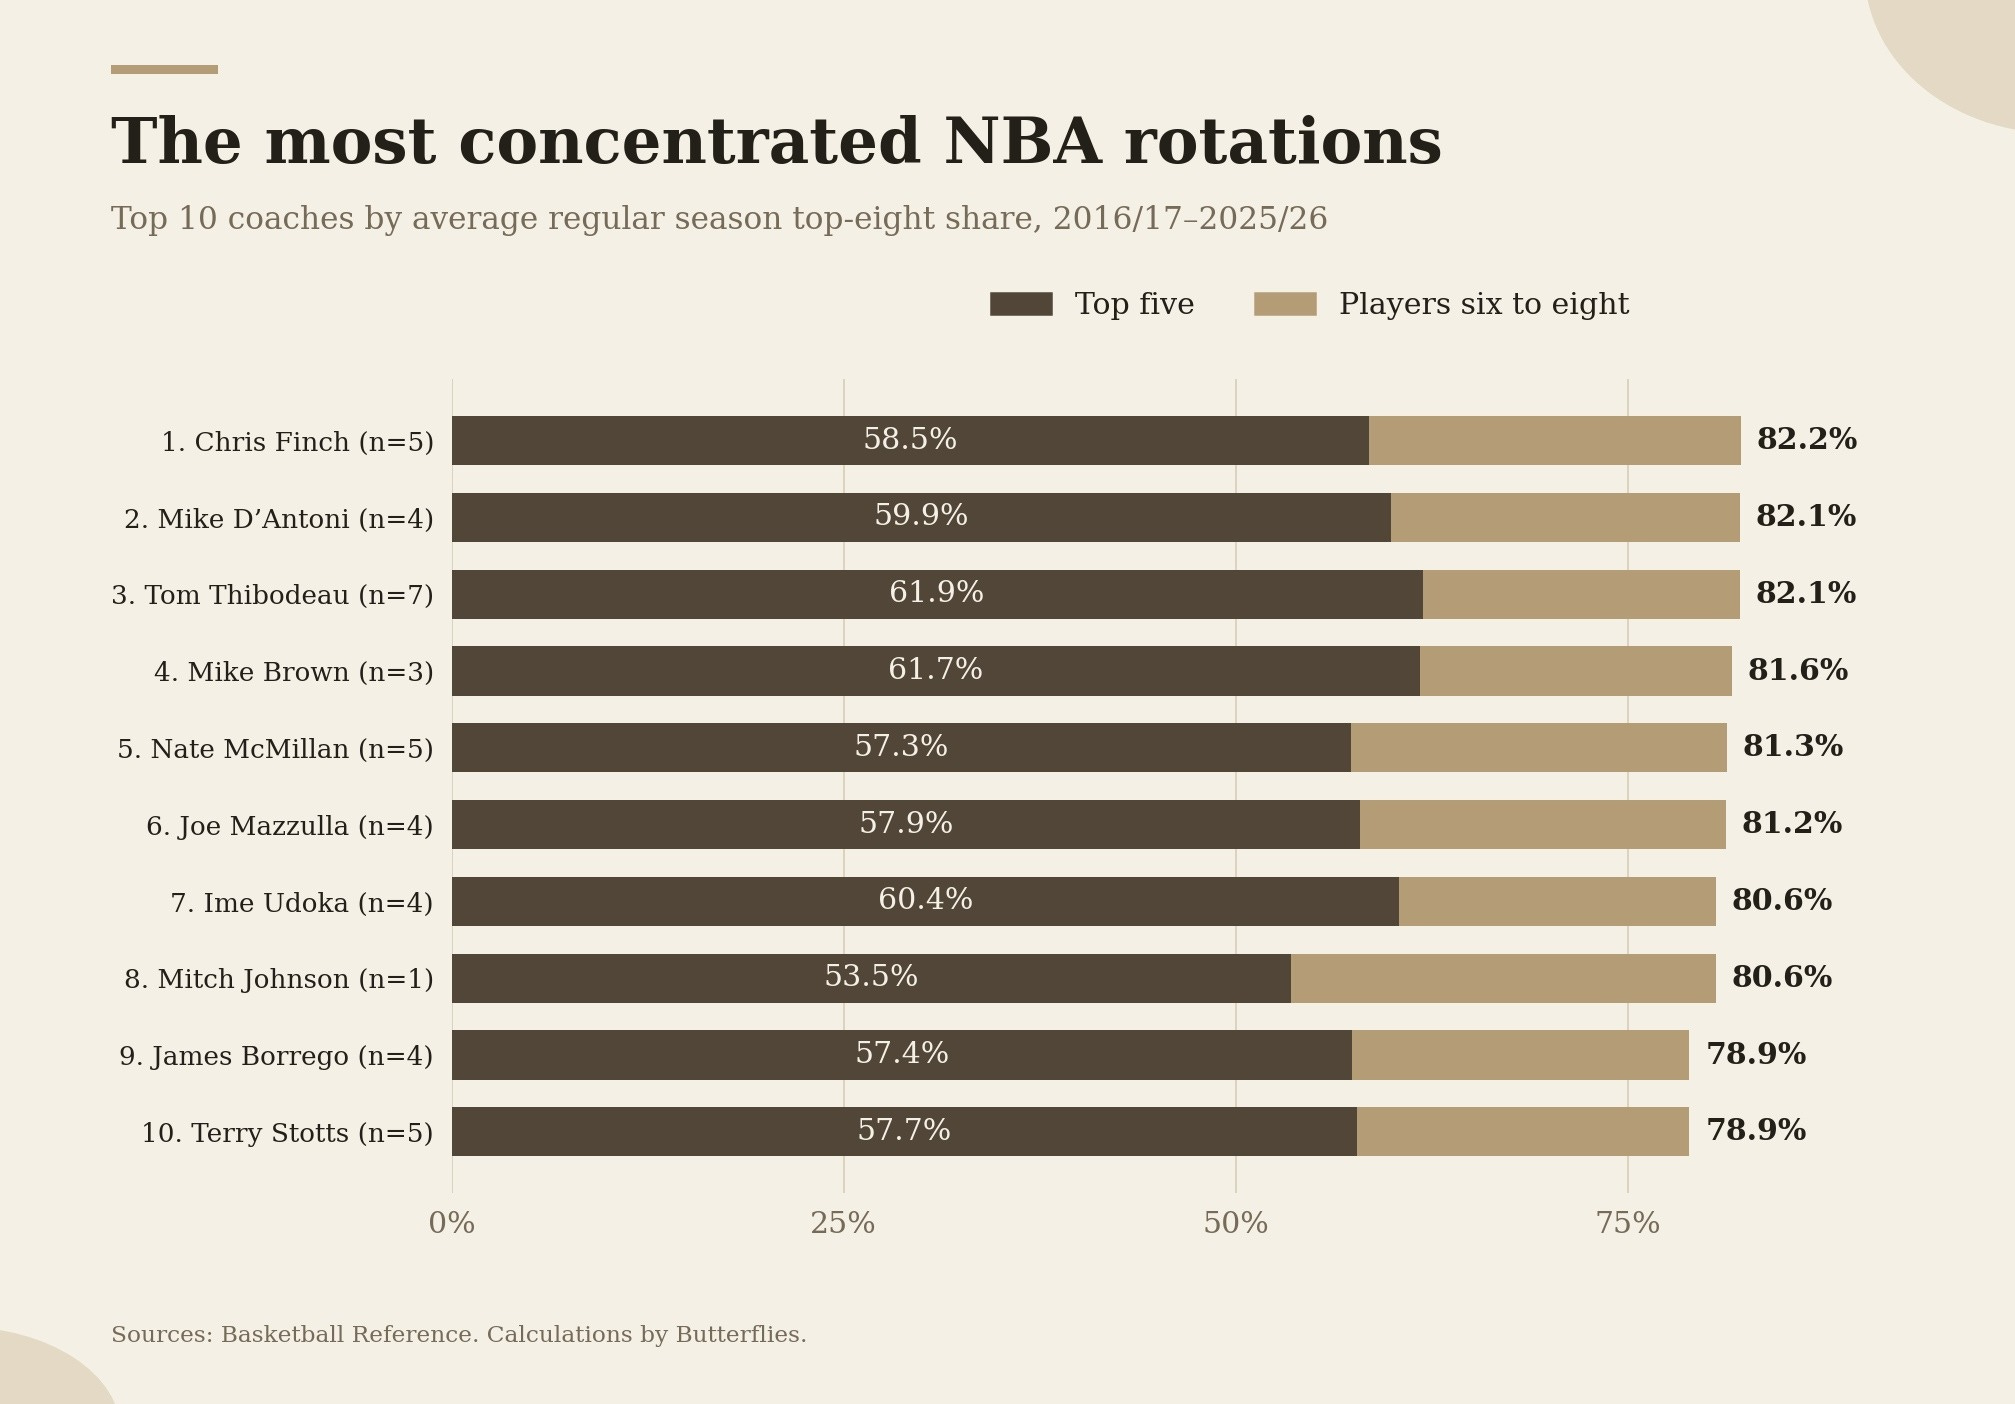
Thibodeau has a reputation for leaning on his top players more than anyone else. But by top-eight share of regular season minutes, he’s actually tied for second in this sample, just behind Chris Finch and even with Mike D’Antoni.
However, if you look at the top five, his reputation holds up. Thibodeau leads every coach in the sample at 61.9%.
The postseason comparison is also interesting. Thibodeau’s top eight averaged 92.8% of playoff minutes across five qualifying playoff runs. As a comparison, Steve Kerr’s top eight averaged 85.7% across six seasons.
The Burden of Being Indispensable
Counting how many games a player played in an 82-game season doesn’t tell us how much basketball a player actually played. Just ask Victor Wembanyama. He argued last season that minutes should be looked at to become eligible for season awards instead of a strict games-played threshold. But even after the 82-game regular season is played, the most important minutes to be played are still to come in the playoffs. And those extra minutes can take a toll.
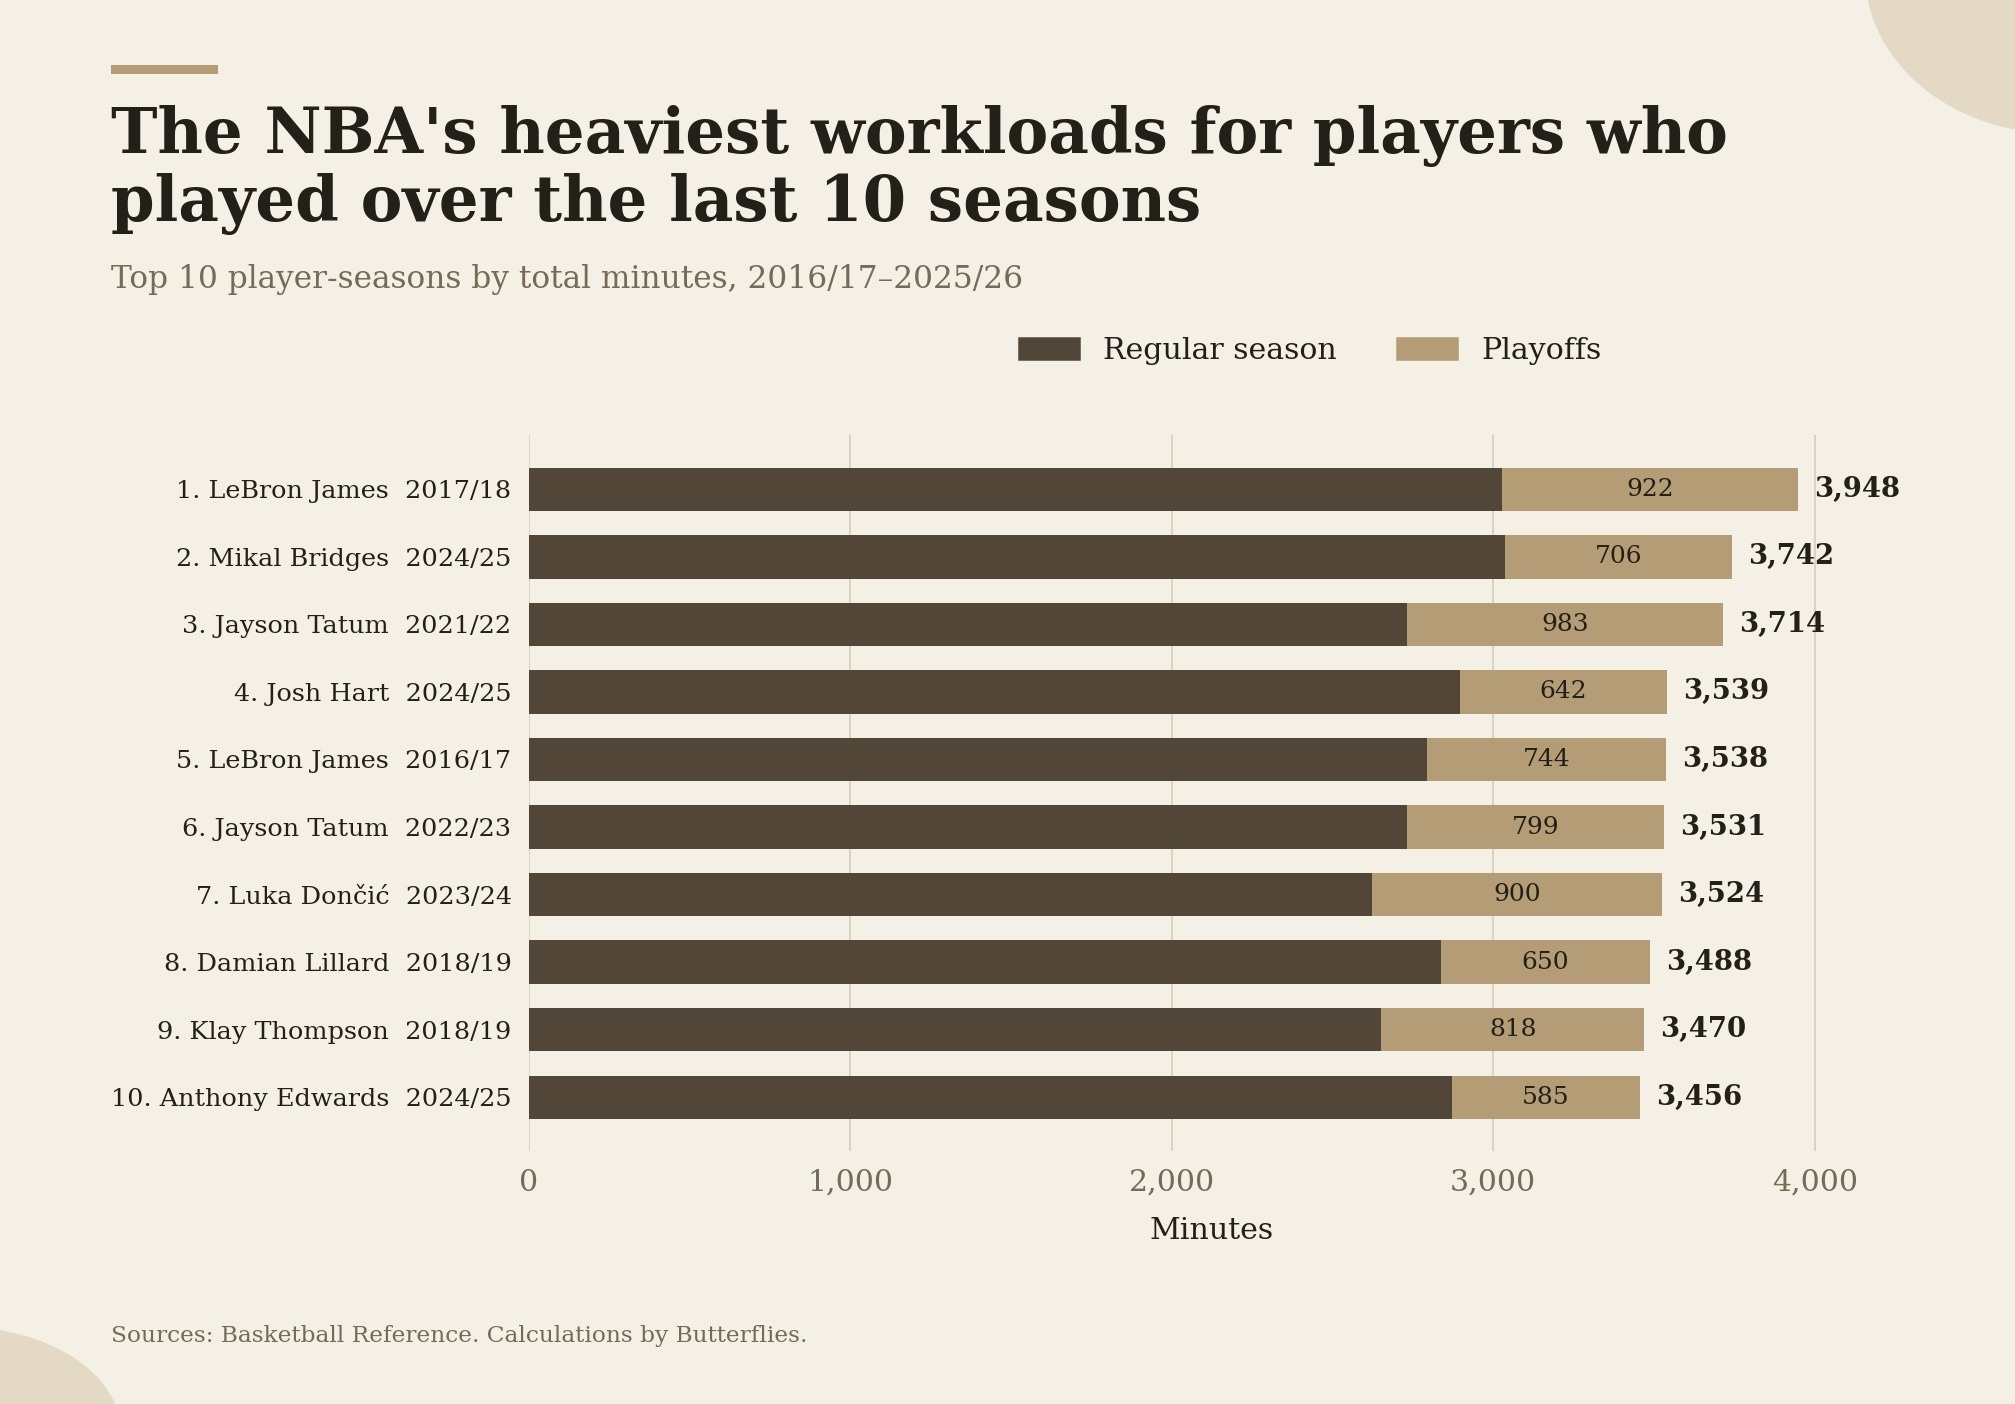
For example, take Jayson Tatum in 2021/22. He played 2,731 regular season minutes. Boston then made the Finals, and he added another 983 in the playoffs. His total for the season reached 3,714 minutes.
The playoffs increased his season’s playing time by 36%. To put that in perspective, 983 minutes is almost 33 additional games for someone averaging 30 minutes a night.
Imagine finishing the regular season knowing you have another third of a season’s worth of minutes ahead of you. Obviously, those are the minutes players want most. Nobody is asking to lose in the first round so they can take an earlier vacation. Still, winning creates a physical burden for players at the top.
LeBron’s 2017/18 season was the highest in the ten-year sample. He played 3,026 regular season minutes and another 922 in the playoffs, finishing at 3,948.
And this isn’t a workload just reserved for the league’s biggest stars. Mikal Bridges played 3,742 combined minutes for the Knicks in 2024/25 and Josh Hart played 3,539 that same season. They can thank Thibodeau for that (lol). Both finished ahead of plenty of players with more individual accolades.
The Accumulation of a Career
Two players can have the same number of seasons on their Basketball Reference page while having played very different amounts of NBA basketball. We often compare players by age. Once a player turns 30, we start wondering how much longer he has left. But two 30-year-olds can have very different wear and tear based on the minutes they have played.
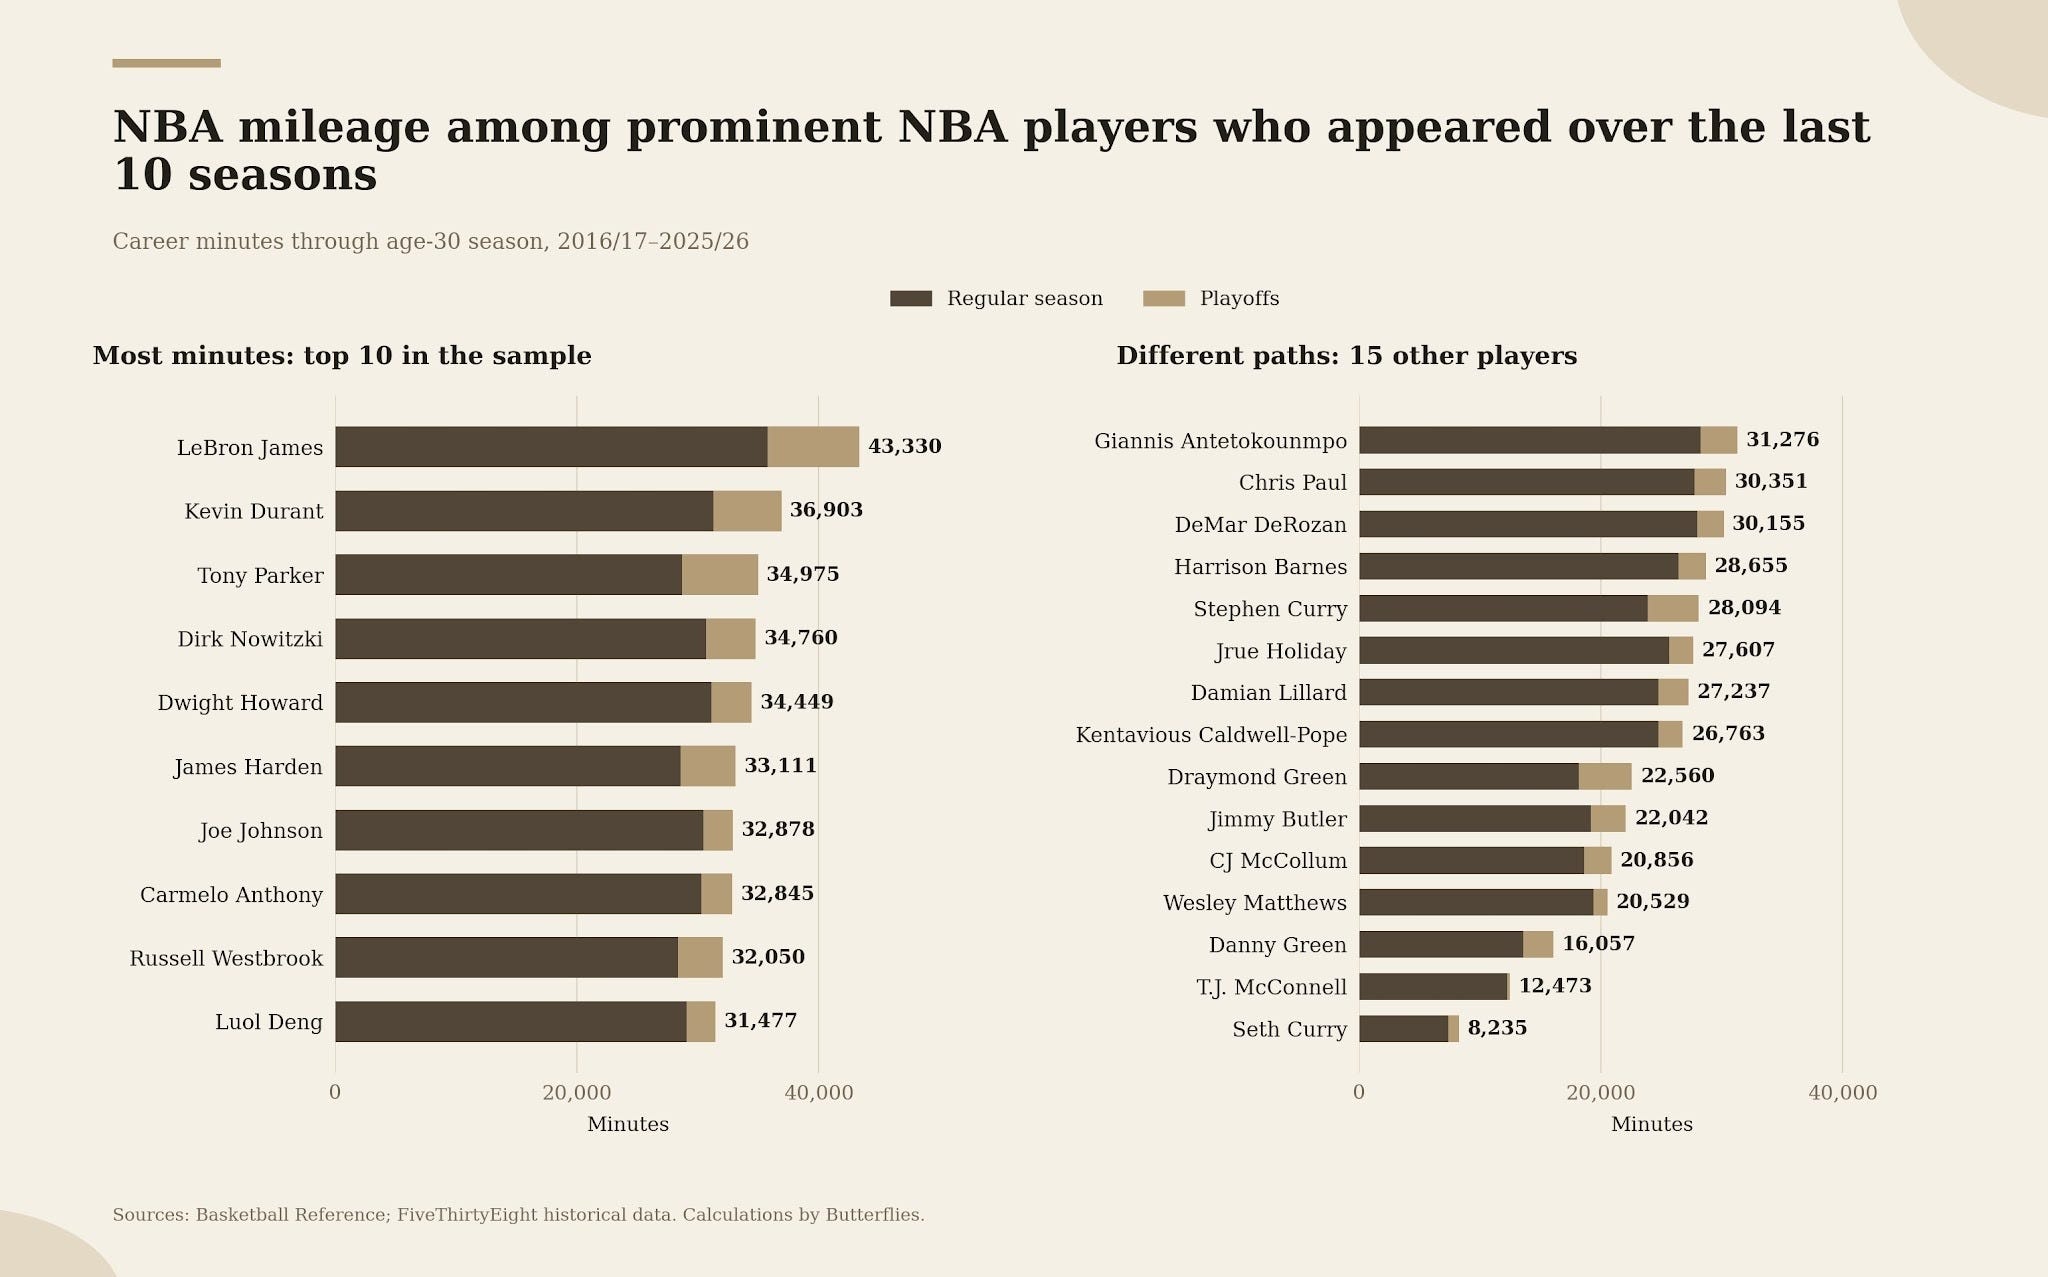
The longevity of the players at the top of the minutes played list is quite extraordinary. To put it into perspective, LeBron had played about 59% more NBA minutes than Dame Dillard at the same age of 30. The gap was 16,093 minutes. Using 30 minutes per game over an 82-game season as a benchmark, that’s roughly six and a half seasons of playing time.
Six and a half seasons. At the same age.
Part of that difference in minute accumulation between the players who have played the most and everyone else comes from entering the NBA earlier, availability and roster makeup, and the playoffs. But it still takes a special type of endurance to be at the top of this list.
Earning the Next Minute
I want my favorite team’s best players on the court when the game is close. That’s part of being a fan. But looking at these numbers changes how I think about the player coming out of the game and the one checking in. One has earned the responsibility of being difficult to replace. The other needs enough opportunity to show he can be trusted. Coaches have to keep deciding how to divide minutes.
The regular season requires a team to keep functioning as its available puzzle pieces change. The playoffs are then where the stars have to show up and perform night in and night out, accumulating one minute at a time.